If sealed Production rate 111 + 233 ppm per minute . So reach over 1000 ppm in 3 minutes if completely sealed with around 1 liter each in a car taped up.
Analyzing Gas Concentration and Determining Peak Time
The following data points show the concentration of gas 'hh' over time in a 100 cubic feet chamber:
- 4:00 pm (0 minutes): 0 ppm
- 4:09 pm (9 minutes): 1000 ppm
- 4:28 pm (28 minutes): 1000 ppm
- 4:31 pm (31 minutes): 300 ppm
The reaction is expected to peak at 15000 ppm, and there are air leaks in the chamber.
1. Determining the Leakage Rate
The concentration dropped from 1000 ppm to 300 ppm between 4:28 pm and 4:31 pm, a period of 3 minutes. This represents a loss of 700 ppm in 3 minutes. Therefore, the leak rate is approximately 700 ppm / 3 minutes ≈ 233.33 ppm/minute.
2. Estimating the Peak Time
The initial production rate was approximately 1000 ppm / 9 minutes ≈ 111.11 ppm/minute, as the reaction started at 0 ppm at 4:00 pm and reached 1000 ppm at 4:09 pm. However, the concentration at 4:28 pm was still 1000 ppm, which suggests the production rate had slowed or the leakage was influencing the overall concentration. Given the leakage, the reaction likely reached its maximum production rate before 4:28 pm.
Precisely determining when the 15000 ppm peak occurred is impossible without more data. The provided data covers the initial increase and a later decrease in concentration, potentially after the peak has already passed. Maximum concentration (Tmax) can occur shortly after the start of a reaction.
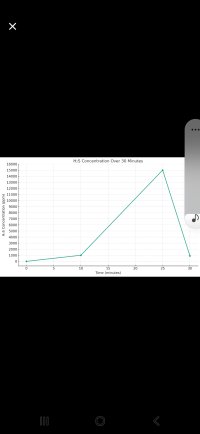
3. Plotting the Graph (PPM vs. Time)
A rough graph can be plotted using the provided data points, while recognizing the actual path to the peak is unknown.
15000 (Expected Peak)
|
|
|
| 1000 ppm
| /
| /
|/ \ 300 ppm
---+--------+--------+--------
0 9 28 31 Time (minutes